Contents
Introduction to CAAT Tools
Usually, the traditional audit schemes in organisations address the problems in a company based on the limited information available to them. to overcome this limitation faced by the corporation CAAT is adopted in mostly all the organisations in the current scenario.
Computer-aided audit tools or CAAT is an automated practice done by using different software available to the auditor. The most commonly used practices involve basic office software like MS Excel, Word processors etc.
When we have professional auditors why is it necessary to use CAAT Tools?
Meaning of CAAT Tools
CAAT or CAATT (computer-assisted audit tools and techniques) is the growing sector in the IT Audit Industry because of the growing use of technology. In the present scenario, we know that AI is even substituting the human activities that are carried out. So, we know how much important computer-based activities are in the organisation. As it is a growing sector day to day innovations take place in this sector. There is much more advanced software available to them regarding CAAT. This tool mainly helps in surfing from the irregularities and facilitates forensic accounting.

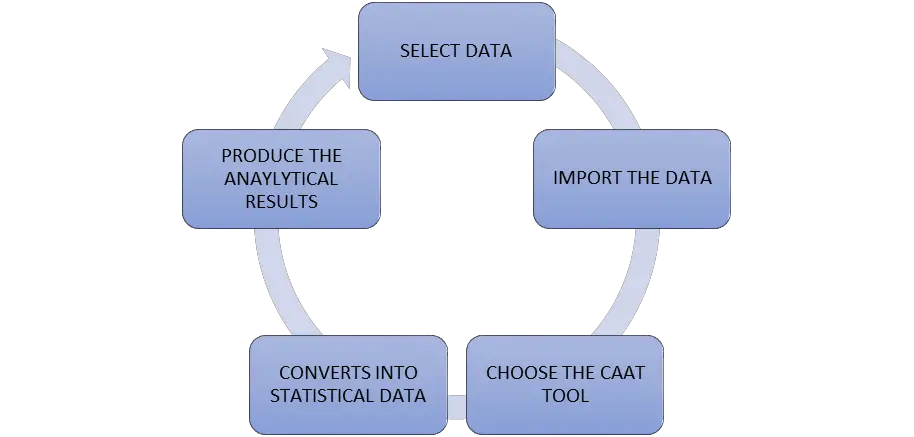
From the above balance, we can see that CAAT weigh more than the traditional audit method that is carried out by the organisation. But when we look deep into this matter there are certain limitations for CAAT:
- CAAT is done based on data that is saved in a specific pattern. Any error in the saved data will not give you accurate results.
- Audit tools are also needed for CAATs to work efficiently. CAAT is a complement to the different tools used in the organisation to increase audit accuracy.
- In some cases, CAATs cannot be used whereas in other cases the only possible way to find a solution will be by using CAATs. So, this is a situation-based method.

Analytical reports are the mostly used outcome of the audit function. The analysis is made regarding different functions of the organisation like market status, financial requirements, trends of the market etc. These reports give a clear-cut idea of what should be done in a situation like that.
Analytical Report
The end report of the analysis carried out is stated statistically and accurately in the analytical reports produced by each department. Analytical reports are generated by analysing the different strategies carried out in the organisation and their outcome. Both quantitative and qualitative data are taken into consideration while preparing analytical reports. The business insights of the firm are straightened out with the help of the data provided this helps in taking the business decisions of the organisation.
Analytical reports play the most vital role in maintaining the correct business insights of the firm. Analytical reports are the main outcome of audit activities. When data analytics are done in a firm it is usually called business analytics. This is where the data provided in the business is analysed like the trend of the market, the earning figures of the firm are analysed and conclusions are drawn.
From the above, we can conclude that analytical reports are mainly done to identify the problems arising in the business and draw conclusions to the problems raised. They also state the upcoming opportunities and give us the best way to optimise the opportunity.
Now let us look into the different tools used to generate data.
Sorting and Charting
Everything feels better it gives us a visual treat. So, when we have bulk data when it is listed down the analysis tends to be a little complicated. Sorting and charting help to filter this data and represent it attractively. Sorting means arranging the data into a specific order as per their nature. This may be done regarding common characteristics possessed by them. The most commonly used sorting technique is either ascending order or descending order. This data that is sorted is plotted into a chart. They provide a visual appeal to the person analysing the data. It is easier to understand and will have a deeper impression on our memory. We all remember the movie we watched years ago more clearly than what we studied last night right? The same technique is used here. The most commonly used charts are bar charts, histograms, line charts etc.
Stratification
The basic idea of stratification is grouping into batches of the same characteristics to understand the meaning and gain knowledge regarding the same. When there is a large pool of data it will be difficult to analyse the huge data. To avoid this confusion stratification is adopted. Stratification is usually combined with other tools to use its full efficiency.
Summarization
When the whole is summarized into a few points. We understand things better when it is to the point and not vague. Summarization mines the dataset and gives us compact information regarding the same. It is mainly the presentation of the data generated in the previous steps in the most efficient manner.
Statistics
It is usually the numerical representation of the data. They usually represent the data in the active database of the company. They help us to measure the range of the data in the analysis and points out the mathematical errors hidden in them. They are the most widely used mathematical technique.
Conclusion
CAAT is the most efficient technique used to produce efficient audit reports in a firm. They increase efficiency and reduce the errors that are produced manually while doing the audit. The analytical reports generated at the end of business analysis can be generated for various uses that arise in the organisation. Thus in this AI world, CAAT plays a vital role in the functioning of the firm.